Sample Chart Only – Not Current Data.
Click here for the current data and chart.
Source: Federal Reserve Bank of Philadelphia http://www.philadelphiafed.org/index.cfm
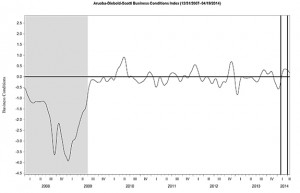
The Aruoba-Diebold-Scotti business conditions index is designed to track real business conditions at high frequency. Its underlying (seasonally adjusted) economic indicators (weekly initial jobless claims; monthly payroll employment, industrial production, personal income less transfer payments, manufacturing and trade sales; and quarterly real GDP) blend high- and low-frequency information and stock and flow data. Both the ADS index and this web page [http://www.philadelphiafed.org/index.cfm] are updated as data on the index’s underlying components are released.
The average value of the ADS index is zero. Progressively bigger positive values indicate progressively better-than-average conditions, whereas progressively more negative values indicate progressively worse-than-average conditions. The ADS index may be used to compare business conditions at different times. A value of -3.0, for example, would indicate business conditions significantly worse than at any time in either the 1990-91 or the 2001 recession, during which the ADS index never dropped below -2.0.
The vertical lines on the figure provide information as to which indicators are available for which dates. For dates to the left of the left line, the ADS index is based on observed data for all six underlying indicators. For dates between the left and right lines, the ADS index is based on at least two monthly indicators (typically employment and industrial production) and initial jobless claims. For dates to the right of the right line, the ADS
index is based on initial jobless claims and possibly one monthly indicator.

