The charts and other material that are posted here on a periodic basis are designed as snapshots of what is happening in business, finance, the economy, and the investment arena. More complete charts and analysis are found in the various sections of the Intrinsic Value Wealth Report(TM).
Current Charts for Review and Thought
Posted December 4, 2018
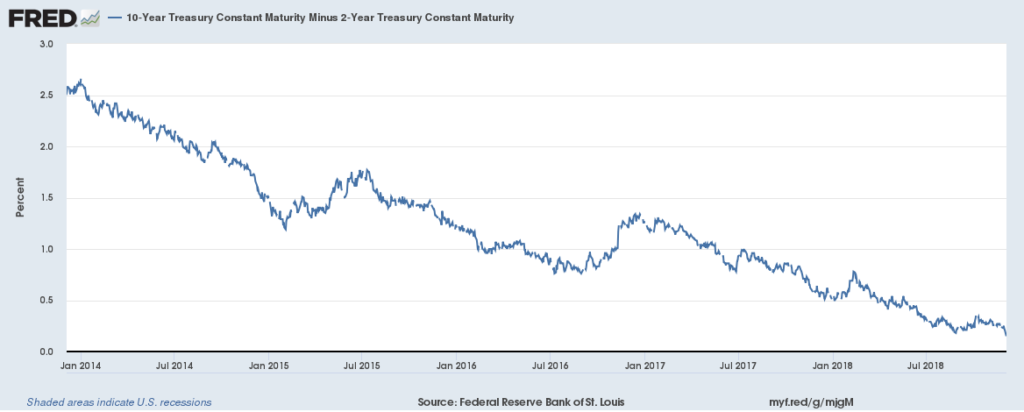
An Inverted Yield Curve is often a signal of a coming economic recession. The Yield Curve, as shown below by the difference between the 10-year Treasury and the 2-year Treasury, is very near an inverted status where the 2-year Treasury has a higher yield than the 10-year Treasury.
Posted January 28, 2016
The AAII Investor Sentiment Survey measures the percentage of individual investors who are bullish, bearish, and neutral on the stock market for the next six months. Click the link below to see the current reading:
AAII Investor Sentiment Survey
Archived Charts for Review and Thought
Posted December 13, 2015
Inflation is a key concern for the Federal Reserve as it considers raising rates next week. The following Wall Street Journal article, As Fed Sets Pace on Rate Increases, Watch Inflation, discusses how inflation concerns are weighing on the Fed’s decision as to whether to raise rates and by how much. You will need to subscribe to the Wall Street Journal in order to access the complete article.
Posted July 19, 2015


